


Up to this point, the S&P 500 ($SPX) has now stayed above the 6,200-mark for eight straight days. The upside follow-through has been limited, but the drawdown has also been shallow. The onus continues to be on the bears to do something with the stretched state. We discuss this in terms of the CappThesis Market Strength Indicator below.
What Is the Market Strength Indicator (MSI)?
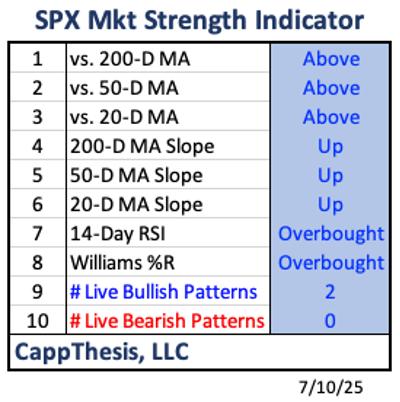
When the market makes strong moves, like they have recently, I like to review our Market Strength Indicator (MSI). This isn’t some secret, proprietary formula. It’s a simple blend of trend, oscillator indicators, and patterns, factors that we base our market stance upon.
And surprise, surprise, the MSI is as bullish as can be with the SPX at new highs and up 30% in three months.
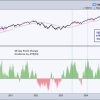
- The S&P 500 is trading above each moving average, and each moving average is sloping higher.
- The 14-day Relative Strength Index (RSI) and Williams %R are both overbought. We use both of these since it takes a considerable up move to get the RSI to overbought territory. And while the Williams %R swings to extremes much more easily, it can only stay overbought if the market continues to tick higher with minimal drawdowns. Clearly, all of this has been happening.
- And, of course, two big pattern breakouts remain in play. Two weeks ago, the MSI was even more extreme when we had four patterns in play at the same time.
Here are each of those indicators together on one chart. (We don’t show the patterns here since it would be way too much to display all at once – and that would be an offensive chart crime.)
The clear next question:
Now what?
Market Strength Indicator Now vs. April 7, 2025
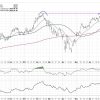
First, the obvious. The MSI was completely depressed on April 7 after two months of intense selling and extreme volatility.
Interestingly, though, after that last massive downside gap on April 7, the final bearish pattern target was hit. That set the stage for a bottoming process to potentially begin.
With the pendulum now having completely swung from historically oversold to now extended, does a very bullish MSI suggest the upswing is unsustainable?
Bulls and bears agree on one thing these days: The pace of the last three months can’t continue, and at any time, a pullback greater than the 3.5% drop from mid-May is going to happen. It’s just a matter of when.
Now let’s look at the recent times when the MSI got to extreme levels like now.
Market Strength Indicator Now vs. 2023–24
The results are crystal clear. “Extreme” MSI readings are the result of strong technicals, which occur in uptrends. And uptrends tend to last longer than many think is possible or probable.
From this perspective, only once did a correction begin right after a high MSI reading – in July’24. At the time, though, only one bullish pattern was in play (the one with the long-term 6,100 target that was triggered way back in Jan’24).
Now, of course, we have two live bullish formations, and for the uptrend to persist without a major market disturbance, we’ll need to see the next bout of profit-taking morph into the next set of short-term bullish formations.
Live Patterns
Our two live patterns remain – targets of 6,555 and 6,745, which could be with us for a while going forward. For those to eventually be achieved, though, new, smaller versions will need to be constructed.
Live Patterns
Our two live patterns remain – targets of 6,555 and 6,745, which could be with us for a while going forward. For those to eventually be achieved, though, new, smaller versions will need to be constructed.